Climate Spiral: 1880
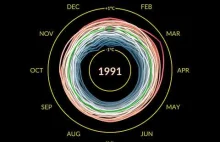
The visualization shows monthly global temperature anomalies between the years 1880 and 2022 in degrees Celsius. Temperature anomalies are deviations from a long term global average. In this case, the period 1951-1980 is used to define the baseline for the anomaly. These temperatures are based on th
z- 1
- #
- #
- #
- #