In the past two days, Bitcoin price has seen heavy corrections. Dropping from $ 58000 to $ 45000, it settled below the 100 hourly simple moving average. The drop was prompted by a whale moving 28,000 BTC worth $ 1.6 billion to crypto exchange Gemini.
The Bitcoin price now is recovering losses. There was a break above the 23.6% and 38.2% Fib retracement level of the downward move from the $ 58.400 swing high to $ 45,000 low. The first major resistance is now forming near the $ 51,700 level. A close above the $ 51,700 resistance level could push the BTC USD price towards $ 53,250 and $ 55,000 in the near term.
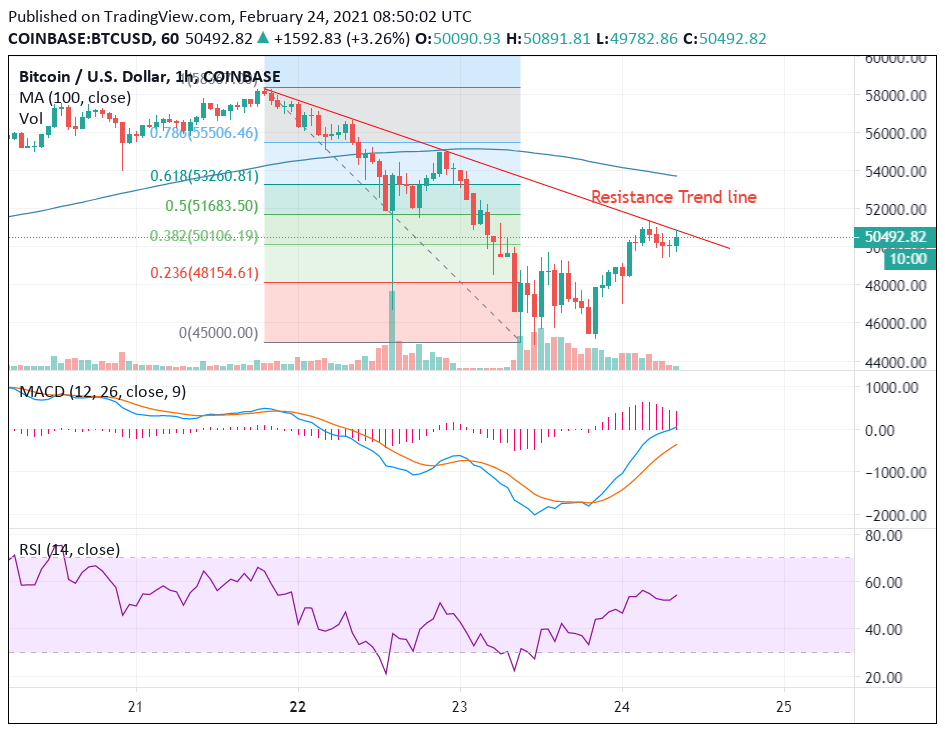
If bitcoin fails to continue higher above the resistance trend line, there are chances of dips. An initial support on the downside is near the $ 48,000 level and $ 45000 as the key support zone. If there is a clear break below the $ 45,000 support, the Bitcoin USD price could dive lower. The next major support for Bitcoin sits near the $ 40,000 level.
- Technical indicators:
Hourly MACD - The MACD for BTC / USD is slowly gaining momentum and heading towards the bullish zone.
Hourly RSI (Relative Strength Index) - The RSI for BTC / USD is now above 50.
Major Support Levels - $ 48,000, and $ 45,000.
Major Resistance Levels - $ 51,700, $ 53,250 and $ 55,000.
BTC USD Price Live chart momentum.


Komentarze (2)
najlepsze
To w sumie jest chyba największa słabość rynku krypto - cały rynek umiera razem z jednym BTC. Dlatego większa decentralizacja i